Please ensure Javascript is enabled for purposes of website accessibility

A graphic breakdown of housing affordability in Florida

Data from the Florida Housing Summit held earlier in May puts a spotlight on the state's lack of housing available in a variety of price points.


  • By Louis Llovio
  • | 5:00 a.m. May 22, 2024
  • | 2 Free Articles Remaining!
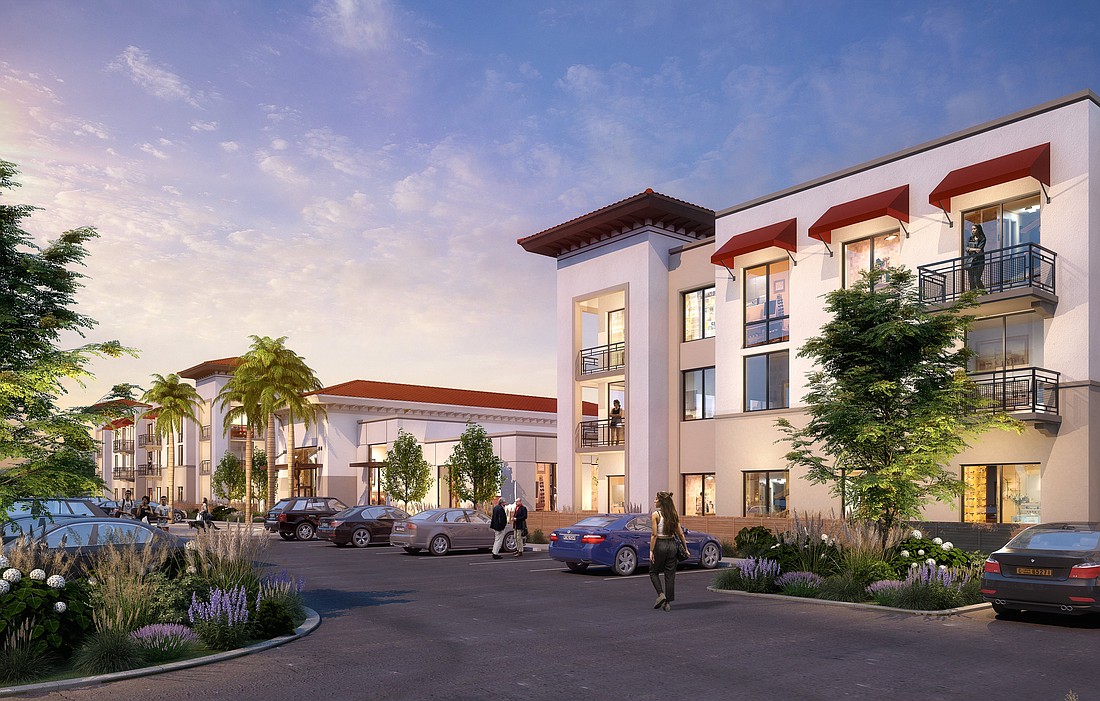
A 354-unit affordable housing apartment complex is being built on the site of the former Fun-Lan Drive-in.
Image via City of Tampa / Facebook
  • Florida
  • Share

Finding housing in Florida is neither easy nor inexpensive.

And data presented by the Urban Land Institute at the Florida Housing Summit on May 1 show just how dire the situation is for those who are working to get by.

The figures highlight just why it is difficult for those in the workforce to both find housing and, when they do, afford it.

The figures below, and the comments, were presented by Rosemarie Hepner, vice president of the ULI Terwilliger Center for Housing, at the event and in a follow up email.

While the presentation included what can be done to address the issue over the long term, here is a snapshot of how housing production and housing costs are affecting the state’s workforce.


Housing production as it relates to household growth. None of the Florida markets are producing enough new housing to accommodate the population growth.


A healthy housing market would add at least one unit per new household and the Florida markets are underproducing.


The percentage of homes that are affordable to buy for people at 80% area median income. This, along with 120 area median incomer, are your “workforce” groups and the graphs show the percentage of homes that are affordable for them. The Florida markets have fewer homes affordable to 80% and 120% AMI households than the national average, which Is 50% and 79%, respectively.


The percentage of homes that are affordable to buy for people at 120% area median income. It is important to point out that just because, say 72.6% of homes in Tampa are affordable to buy for a household earning 120% AMI doesn’t mean that that type of home is available.


The number of years it takes to save for a downpayment for a household earning 80% area median income. The national average is 25 years.


The percentage of the rental stock that is affordable to a household earning 80% area median income. The national average is 80%, so a few markets are doing better — Pensacola, Lakeland. And just because 74% of the rentals in Palm Bay are affordable to a household earning 80% AMI, doesn’t mean there are any actually available. That household would then have to find a unit that is smaller than what they need, or in some other way, cheaper than what they can afford, putting downward pressure on the market.


The time it takes to save to move — first/last month’s rent and a security deposit — at 50% area median income.


Charts courtesy of the Urban Land Institute


author

Louis Llovio

Louis Llovio is the deputy managing editor at the Business Observer. Before going to work at the Observer, the longtime business writer worked at the Richmond Times-Dispatch, Maryland Daily Record and for the Baltimore Sun Media Group. He lives in Tampa.

Latest News

×

Special Offer: Only $1 Per Week For 1 Year!

Your free article limit has been reached this month.
Subscribe now for unlimited digital access to our award-winning business news.
Join thousands of executives who rely on us for insights spanning Tampa Bay to Naples.